Executive Summary
Our values about the world and our place within it touch every aspect of our lives: from the relationships we form, the careers we pursue, and the ideologies we endorse. It is therefore no surprise that understanding an individual’s values and motivations is of significant interest to psychologists and organizational leaders. This is of real practical importance given the widespread prevalence of disengagement at work (Gallup, 2019). This is ultimately leading to feelings of burnout and dissatisfaction with life and work, alongside reduced performance and effectiveness (Achor, Reece, Kellerman, & Robichaux, 2018; Leary et al., 2013; Pew Research Center, 2016).
The evidence is clear, organizations are failing to inspire and motivate their employees, and ultimately harming their ability to attract and retain the talent needed for them to win. If the DNA of human motivation can be decoded, people will be better understood, lead more purposeful lives, and be better engaged at work. It is for this reason we created the Core Values Diagnostic.
The Deeper Signals’ Core Values Diagnostic measures an individual’s motivations, values, and goal-directed behaviors. The diagnostic is built upon Self-Determination Theory (SDT, Gagné & Deci, 2005), which describes human motivation to be a product of three motivations: the need for independence, the need for competence, and the need for connection. The Core Values diagnostic is quick, accurate, and provides deep psychological insights. The diagnostic was developed using a sample of 12,000 working adults and robust psychometric techniques, is free of bias and adverse impact, and has been validated against a large battery of psychological constructs and work-related behaviors.
Uses & applications
All organizations experience people problems, and most of these problems are a product of being misunderstood. If people can better understand themselves and their colleagues, and if organizations can understand their talent, the workplace can become a more productive and engaging place.
Accordingly, the Core Values Diagnostic was designed to aid in this endeavor and serve three purposes:
- Help individuals better understand themselves, the activities and tasks that engage them the most, and the environments that they will thrive within.
- When an individual’s values match those of their career, increased levels of satisfaction and performance can be expected (Chatman, 1989).
- Enable managers to harness the cognitive diversity of their teams and coalesce their direct reports around shared goals and objectives.
- Cognitively diverse teams are higher performing compared to homogenous teams (Bell, 2007; Bell & Brown, 2015).
- Provide leaders with an understanding of their organization’s culture and the extent to which it is suitable for its strategic goals.
- Organizational culture is a leading predictor of performance and innovation (Hogan & Coote, 2014; Ogbonna & Harris, 2000).
The Core Values Diagnostic can be used by I/O psychologists, practitioners, and leaders to inform talent management strategies, improve coaching and development, and support organizational change and strategic initiatives.
The Core Values Diagnostic is administered on a modern, secure, and regulation compliant technology platform (“The Deeper Signals Platform” ). Upon completion respondents are presented with an interactive and intuitive report that describes their results. Specifically, they receive feedback on their Core Values, helping them gain awareness around the activities, careers, and work environments that they are likely to be engaged the most by. Administrators of the diagnostic will also have access to data visualizations to then further understand their employees, inform team development and leadership, and map the organizational culture.
Target Audience
The Core Values Diagnostic was designed to be used in talent management contexts. Specifically, it can be used to inform talent decisions and development for those working in individual contributor, management, and leadership roles. The diagnostic is industry agnostic, and scores are not impacted by previous vocational or educational experiences. The assessment was not designed to be used by anyone under the age of 18. The diagnostic was developed for English speakers; however, translations are available upon request. When translating the diagnostic, replication studies would be conducted to ensure there is measurement invariance between English and non-English versions.
Theoretical Rationale
Psychologists have long sought to understand how individuals are both similar and different in what drives behavior, motivates and inspires action, and how their professional and life goals are selected and pursued. While there have been many approaches and perspectives proposed to explain such facets of behavior, the scientific community has settled on the fact that human motivation largely derives either from intrinsic or extrinsic factors.
Extrinsic motivation describes the extent to which people are motivated by material or external rewards, whereas intrinsic motivation describes the extent to which people act out of internal interest and enjoyment. In other words, the reward is doing the act itself (Ryan & Deci, 2000). As one can expect, individuals vary in the extent to which they are motivated by intrinsic or extrinsic factors, however it is intrinsic motivation that is of most interest to psychologists and practitioners as it is associated with many positive life outcomes, and largely resistant to contextual factors (Gagné & Deci, 2005; Ryan & Deci, 2000). When leaders talk about creating a workforce that is inspired and value driven, they are describing the desire to have an intrinsically motivated workforce. How does one go about achieving this?
Answering this question, the psychologist Angela Duckworth astutely notes, “human beings all want three things. One is to be competent, one is to belong, and one is to be free, as in to have choice: to not be told what to do but to choose what to do”. Here she is describing Self-Determination Theory (SDT), a macro-theory of human motivation that describes one’s ability to live an intrinsically motivated and self-directed life as a function of one’s ability to satisfy needs for autonomy, competence, or relatedness (Deci & Ryan, 2012). These three needs operate at a macro level of human psychology and can be broadly described as “innate psychological nutriments that are essential for on-going psychological growth, integrity, and well-being” (Ryan & Deci, 2000, p.229).
The Need for Autonomy can be described as “the need to self-organize experience and behavior to have activity be concordant with one’s integrated sense of self” (Ryan & Deci, 2000). Alternatively, it describes the extent to which individuals have the ability to have agency, the ability to make one’s own decisions, and have ownership over one’s life. It shares a conceptual overlap with internal locus of control, whereby individuals have volition and agency; they are able to influence the direction of their lives, rather than be subject to external factors that are out of one’s control.
The Need for Competence can be described as “the need to feel a sense of mastery over the environment and to develop new skills” (Van den Broeck, Ferris, Chang, & Rosen, 2016, p.1198). The need for competence arises from the satisfaction and well-being derived from being able to exercise, as well as improve one’s capabilities, skill sets, and knowledge (Ryan & Deci, 2000). This need is most readily met when the presented challenge is not significantly above or below one’s current level of ability.
The Need for Relatedness can be described as “the need to feel belongingness and connectedness with others” (Ryan & Deci, 2000). This need explains an individual’s desire to build and maintain relationships with others, feel a sense of belonging, and the exchange of positive emotions and reciprocal behaviors (Van den Broeck et al., 2016).
As a macro-theory of human motivation, SDT’s primary premise is that based on the extent to which these three needs are met, the likelihood of intrinsic motivation will increase. This position has been empirically supported in numerous scientific studies. Summarizing this research, a meta-analysis of over 100 independent studies found that need satisfaction accurately predicted many positive work outcomes (i.e. job performance & satisfaction, productive & counter productive work behavior, burnout & engagement, etc.; Van den Broeck et al., 2016). Given its theoretical parsimony, explanatory power, and predictive validity, SDT was selected to serve as the theoretical foundation for the Core Values Diagnostic.
Although SDT is a robust framework to understand human motivation, its macro-level perspective poses a challenge when attempting to create a diagnostic tool to inform talent management strategies and decisions. Accordingly, the personal values literature can serve as a more proximal set of concepts that can be more readily measured and engaged (Diefendorff & Chandler, 2010). Where personality describes behavioral dispositions and tendencies, personal values describe individual differences in goals, ambitions, and motivations that transcend specific situations (Parks-Leduc, Feldman, & Bardi, 2015). Values describe foundational goals, ambitions, and identities that serve as heuristics and anchors for behavior and orientating one’s life. The more readily a value is activated, the more likely they are to influence behavior, and result in the individual experiencing positive affect and engagement at work (Rich, Lepine, & Crawford, 2010; Verplanken & Holland, 2002).
The two most popular frameworks of personal values are Schwartz's Basic Human Values model (1994) and Holland’s Vocational Interests (Holland, 1959). Schwartz’ model posits that there are 10 basic values that guide and orient behavior. These ten values have been replicated across various cultures and related to a variety of life outcomes (Schwartz, 2012). Holland’s approach posits six behavioral preferences that are aligned with different career and job types. Empirical research has demonstrated that when these vocational values have been met, the individual is likely to display high levels of job performance (Schnell, Höge, & Pollet, 2013).
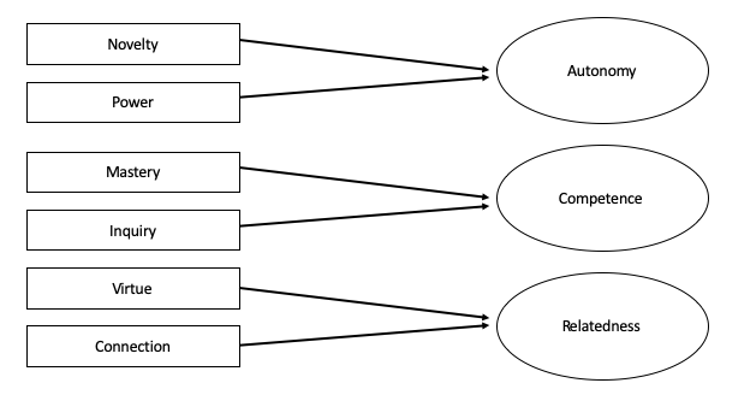
Concluding on the above literature, human motivation can be summarized by three distinct mechanisms. First, it is intrinsic not extrinsic motivation that is most associated with positive life and work outcomes. Second, SDT theory describes three high-level psychological needs that when met produce elevated levels of intrinsic motivation. Last, personal values describe lower-order psychological factors that strongly shape and orient behavior. Given these mechanisms, the Core Values Diagnostic uses personal values to operationalize SDT’s three macro psychological needs. Taking influence from Schwartz and Holland’s frameworks, we identified commonalities between the two approaches and organized them according to SDT’s three needs. This produced a model that has high explanatory power, can produce actionable and practical insights, and is built upon robust scientific rationale. Figure 1 displays the Core Values model.
The Core values model
As illustrated in Table 1 the Core Values model is comprised of six factors that can be aggregated to explain one’s need for autonomy, competence, and relatedness. There are two labels for each of the six Core Values scales, one representing the high side of the scale and one representing the low side of the scale. While the diagnostic is built upon a scientific and empirical model, it leverages the intuitiveness and ease of tools such as the Myers-Briggs Type Indicator. Rather than overwhelming the respondent with many scales and percentage scores, we only present feedback on their most extreme three scores. This is determined by comparing their scores to the normative database and identifying the three scales that deviate furthest from the sample mean. As a result, respondents are given three adjectives that describe their Core Values. For example, an individual with very low Novelty and Power scores, and high Connection scores would be described as believing in Tradition, Humility and Relationships. To help the respondent quickly get to insight and understanding, we do not provide feedback on scores that do not widely deviate from the mean, although this data is available to platform administrators.
The following section describes each of these values, providing an interpretative explanation to assist practitioners to understand scores and provide feedback.
Table 1: The Deeper Signals Core Values Model
The Novelty Value
The Novelty scale describes the extent to which one values change and innovation. Individuals who score high on this scale can be described as risk-taking, constantly seeking and trying new things, and critical of the status quo. Individuals who score low on this can scale be described as traditional, conforming, and upholding of social conventions and norms.
The Power Value
The Power scale describes the extent to which one values social status and dominance. Individuals who score high on this scale can be described as being drawn to positions of leadership and influence, ambitious, and hungry for recognition. Individuals who score low on this scale can be described as being humble, egalitarian, and cooperative.
The Mastery Value
The Mastery scale describes the extent to which one values mastering new skills. Individuals who score high on this scale can be described as being highly focused on their personal and professional development, having a strong need to be competent in their domain, and goal oriented. Individuals who score low on this scale are motivated to live a relaxed life and are unlikely to challenge themselves unless it is necessary.
The Inquiry Value
The Inquiry scale describes the extent to which one values curiosity and difference. Individuals who score high on this scale can be described as having a hungry mind that is curious about the world, tolerant and welcoming towards different people and cultures, and appreciative of arts and culture. Individuals who score low on this scale can be described as practical and pragmatic, preferring to stick to the familiar, and likely to endorse conservative ideals.
The Virtue Value
The Virtue scale describes the extent to which one is motivated by living in accordance to one’s moral code. Individuals who score high on this scale can be described as being principled, of high integrity, and altruistic. Individuals who score low on this scale can be described as having a flexible moral compass, likely to put themselves before others, and preferring to do what is easy over what is right.
The Connection Value
The Connection scale describes the extent to which one values social connection and affiliation. Individuals who score high on this scale can be described as someone who is sociable, strongly prioritizes relationships in their lives, and derives a lot of joy from social connection. Individuals who score low on this scale can be described as being independent, uninterested in building and maintaining relationships, and likely to be candid towards others.
Assessment Development & Psychometric Overview
The following chapter describes the process and methodology used to develop the Core Values Diagnostic. We first outline our process for identifying and developing items. We then present information related to the Diagnostic’s psychometric properties.
Item Development
A scientific and robust development process was used to create the Core Values Diagnostic.
First, Subject Matter Experts (SMEs) with advanced degrees in I/O psychology, individual differences, and psychometric assessments reviewed the scientific literature on popular motivation and values frameworks, specifically Schwartz’ Basic Human Values, Holland’s Vocational Interests, and SDT (Deci & Ryan, 2012; Holland, 1959; Schwartz, 2006). Once this literature had been reviewed, six values were identified. As argued in previous chapters, these six values represent common human values that are both practically relevant at the individual and organizational level and can be organized within SDT’s framework. Specifically, Need for Autonomy (i.e. Novelty & Power values) Need for Competence (i.e. Mastery & Inquiry values), and Need for Connection (i.e. Relatedness & Virtue values).
Second, with a behavioral taxonomy identified, the SMEs generated a pool of items that were hypothesized to sample the behavioral domains of each of the six values. SMEs designed the items using a clear rubric that described each value, ensuring that the most characteristic motivations, goals, values, and attitudes were sampled. Items were checked for face and content validity, alongside social desirability. Modifications were made based on SME feedback. The initial item pool contained 180 item statements (i.e. “I am drawn to risky situations”, “I enjoy learning how things work”, etc.), and are rated on a four-point Likert scale to indicate whether respondents agree or disagree with the statement.
Third, a sample of over 700 working US adults responded to each of the 180 items. Deeper Signals’ team of psychometricians analyzed this data using statistical techniques to reduce the number of items, retaining only the non-redundant and explanatory. As a result of this process, the number of items was reduced from 180 to 42 (seven per scale). As described in the next chapter, each of six scales has desirable psychometric properties.
Fourth, the diagnostic’s construct and concurrent validity was tested. Data was collected from three different samples of working adults. Participants completed both the Core Values Diagnostic, alongside measures of normal personality, values and motivations, vocational preferences, and self-reported work outcomes. These analyses helped us establish the generalizability of the diagnostic’s psychometric properties in different samples, alongside place the diagnostic within a nomological network of psychological constructs.
Last, a global normative database was developed so that scores can be compared and benchmarked against a representative population. Furthermore, tests of group difference and adverse impact were also conducted. This was to ensure that the items and composite scores are not biased against different demographic groups. Data was collected from over 28,000 working adults from North and South America, Europe, Africa and Asia to conduct these analyses.
In sum, data was collected from nearly 40,000 working adults to develop and validate the Core Values Diagnostic. The following chapters describe the results of these analyses and the psychometric properties of each scale.
Descriptive Statistics, Reliabilities & Factor Analysis
The descriptive statistics for the six scales are presented in Table 2. For each scale, the mean score and its standard deviation are presented alongside the minimum and maximum scores, and an estimate of the scale’s reliability.
Each item uses a four-point Likert response method whereby items are either keyed with a 1 (Strongly Disagree) to 4 (Strongly Agree). With seven items per scale, scores can range between seven and 28. As an example, individuals selecting Strongly Agree for every item from the Novelty scale will obtain a score of 28, suggesting the individual values change, innovation, and risk, whereas a score of seven would indicate that the individual values traditions, conventions, and social norms.
When aggregating the data collected, the average score for each scale falls within similar ranges and the standard deviations are comparable. Respective minimum and maximum scores indicate that a wide range of scores were reflected. Finally, the scales display acceptable levels of internal consistency, suggesting that participants respond to each item in a consistent manner (Cronbach, 1951).
Table 2: Descriptive Statistics & Reliabilities.
Factor Structure
As stated previously, the six scales are theoretically organized around the three needs outlined by SDT. To empirically test whether this theoretical model is present in the data, a principal component analysis (PCA) with varimax rotation was conducted. Before determining the number of components to extract a Scree plot was generated. Interpreting this plot, three components appeared to be present in the dataset. The results of the PCA are presented in Table 3.
The rotated pattern matrix reveals three clear components, each of which accounted for a large amount of variance. The Novelty and Power scales strongly load onto Component 1, representing SDT’s Need for Autonomy. The Mastery and Inquiry scales strongly load onto Component 2, representing SDT’s Need for Competence. The Relatedness and Virtue scales strongly load onto Component 3, representing SDT’s Need for Connection.
Based on the presented results, the Core Values Diagnostic has a clear factor structure that adequately represents the theoretical model of which the tool was developed upon.
Table 3: Principal Components Analysis
Scale Correlations
Table 4 contains the correlations between the six scales. These correlations were computed to understand how scores on the six scales are related to each other.
The six scales were found to hold moderate to strong correlations with each other. The size of the correlations varies across scales in a manner that is consistent with the PCA presented above. For example, Novelty and Power are most correlated with each other, suggesting a general tendency to value status, autonomy, and change. Mastery and Inquiry were strongly correlated with each other, suggesting a tendency to value learning, development, and personal growth. Last, Relatedness and Virtue were highly correlated with each other, suggesting the tendency to value relationships, social affiliation, and helping others.
Table 4: Scale Correlations
Validity
The previous chapter demonstrated that the scales exhibit good internal reliability and factor structure. In this chapter, we explore the scales’ construct validity.
First, we answer the question: “to what extent do scores on the dimensions correlate with well-established psychological constructs?” Where convergent validity tests the extent to which a scale correlates with other variables that are hypothesized to measure a similar behavioral domain, discriminant validity tests the extent to which a scale does not correlate with variables that measure different behavioral domains. Establishing convergent and discriminant validity is important in psychometric construction as it places the scales within a nomological network of psychological constructs. This serves as additional evidence that the scales are measuring the intended behaviors and increases the interpretability of scores. Second, we provide evidence that demonstrates the scales’ concurrent validity, thereby answering the question: “to what extent do scores on the dimensions correlate with relevant work behaviors and outcomes?”
Although the below analyses demonstrate multiple forms of construct validity for the scales, further evidence is needed to confirm the scales’ predictive validity. That is, their ability to predict future work outcomes. As stated by the American Psychological Association’s guidelines and regulations, it is critical to demonstrate predictive validity if these scales are to be used in applied settings and inform selection or hiring decisions.
Convergent & Discriminant Validity
The below section describes the measures used to test the convergent and discriminant validity of the scales, alongside the presentation and interpretation of these analyses. To test the scales’ convergent and discriminant validity, we chose inventories that were related to the diagnostic’s theoretical model, and widely validated within research and applied contexts.
Measures
Assessio “Measuring and Assessing Individual Potential - Extremes” Inventory (MAP – X; Akhtar, Ort, Winsborough, & Chamorro-Premuzic, 2019)
Assessio’s MAP-X assessment is a personality inventory based on the DSM-5’s model of personality disorders. Using the Five-Factor Framework of personality, the MAP-X measures the “dark side” of personality. The MAP-X inventory can be used for screening and selection to predict workplace behavior, at the individual contributor, manager, and leader level. The technical manual reports the assessment to have optimal levels of internal reliability, robust factor structure, and hold good concurrent validity with other psychological constructs and work outcomes.
The Dark Triad Dirty Dozen (Jonason & Webster, 2010)
The Dirty Dozen is a 12-item inventory for The Dark Triad of personality. The Dark Triad represents three broad malevolent and agentic dimensions of personality: Psychopathy, Narcissism, and Machiavellianism. Individuals who score highly on these three dimensions of personality are likely to be callous, uncaring, and selfish (Psychopathy), egotistical and over-confident (Narcissism), and manipulative and exploitative (Machiavellianism). These dimensions have been found to predict job performance, engagement, and work-related behaviors (Furnham, Richards, & Paulhus, 2013). Participants responded to each item using a five-point Likert scale (Strongly Disagree / Disagree / Neutral / Agree / Strongly Agree). Each scale was found to have acceptable levels of internal consistency (α > .70).
The Deeper Signals Core Drivers Diagnostic (Akhtar, Ort, Winsborough, & Premuzic, 2019)
The Deeper Signals Core Drivers (CD) Diagnostic consists of 60 forced-choice adjective pairs. The assessment requires individuals to choose adjectives that best describe them. It consists of six dimensions that are based on the Five Factor Model of personality (Donnellan, Oswald, Baird, & Lucas, 2006). These are: Outgoing (Extraversion-Sociability), Drive (Extraversion-Proactivity), Considerate (Agreeableness), Disciplined (Conscientiousness), Stable (Emotional Stability) & Curious (Openness). The scales display good levels of internal consistency (α >.70), and a high level of convergent validity with other measures of the Five Factor Model (r > .50), and other psychometric inventories. Adjective-based assessments such as the CD offer improvements to traditional statement-based assessments as they sample different aspects of personality dimensions (i.e. reputation), are easier to complete, and harder to fake (Meade, Pappalardo, Braddy, & Fleenor, 2018)
The Hogan Personality Inventory: International Personality Item Pool Form (HPI; Goldberg et al., 2006; Hogan & Hogan, 2007)
This inventory is a non-commercial version of the HPI — a popular personality assessment used in selection and development contexts. The HPI has been found to predict a range of relevant work outcomes, such as job performance, leadership effectiveness, and innovation (for a review, see Akhtar, Humphreys, & Furnham, 2015). The HPI measures seven behavioral dimensions: Adjustment, Ambition, Sociability, Interpersonal Sensitivity, Prudence, Inquisitiveness, and Learning Approach. The inventory consists of 70 items, with participants responding to each item using a five-point Likert scale (Strongly Disagree / Disagree / Neutral / Agree / Strongly Agree). The average correlation between the HPI and HPI scales is .70, suggesting a high level of convergent validity between the commercial and non-commercial version of the assessment.
The O*NET Vocational Interests Profiler – Short Form (Rounds, Su, Lewis, & Rivkin, 2010)
This inventory contains 50 items that measures an individual preference across the six vocational interests outlined by Holland (1959): Realistic, Investigative, Artistic, Social, Enterprising, and Conventional. Items ask individuals to indicate how much they would enjoy performing certain tasks (i.e. “Build kitchen cabinets”) using a 4-point Likert scale. The inventory has satisfactory psychometric qualities and is used widely in career guidance, job selection, and career development contexts.
The Schwartz Basic Values Inventory (Schwartz, 1992)
The Schwartz Basic Values inventory contains 45 value adjectives that measure 10 basic values: Power, Achievement, Hedonism, Stimulation, Self-Direction, Universalism, Benevolence, Tradition, Conformity, and Security. Participants rate each value indicating on an 8-point Likert scale how much of a life-guiding principle the value is. The ten values have been found to be replicated in a variety of different cultures (Schwartz, 2012), and the inventory has been found to have good psychometric properties (Lindeman & Verkasalo, 2005).
Convergent & Discriminant Validity Results
The following section describe the convergent and discriminant validity of the Core Values Diagnostic. Specifically, we discuss and interpret the largest correlations held between the battery of psychometric inventories and the Core Values Diagnostic. We first discuss the relationship between the Core Values Diagnostic and measures of normal personality, followed by dysfunctional and maladaptive dispositions, and finally, other values frameworks. Table 5 contains the correlations between the values and other psychological measures.
Rows 1 to 13 display the relationship between the Core Values Diagnostic, and the Core Drivers Diagnostic and the HPI. The six values hold many statistically significant correlations with both personality inventories, placing the six scales within a taxonomy of personality constructs and portraying a clear behavioral profile. For example, individuals who have strong:
- Novelty values can be described as sociable, ambitious, adaptive, flexible, and curious.
- Power values can be described as competitive, straightforward, confident, and assured.
- Mastery values can be described as disciplined, intellectual, and goal oriented.
- Inquiry values can be described as curious, open-minded, and welcoming of difference.
- Relatedness values can be described as sociable, sensitive, and cooperative.
- Virtue values can be described as caring, moralistic, and empathetic.
Rows 14 to 16 display the relationship between the Core Values Diagnostic and the Dark Triad. It can be seen that Novelty and Power values are positively correlated with the three dark dimensions, while Inquiry is negatively correlated. These relationships indicate that individuals who value autonomy, power, control and dominance, and are suspicious of others, are more likely to be callous, self-serving, manipulative and narcissistic.
Rows 17 to 21 display the relationship between the Core Values Diagnostic and the MAP-X. Under times of stress or pressure, or when not managing one’s reputation, individuals who value:
- Novelty and Power can be described as insensitive, impulsive, intense, unrestrained, and eccentric.
- Mastery can be described as obsessive, unrestrained, and conformist.
- Inquiry can be described as oversensitive, obsessive, unemotional, unrestrained, and conformist.
- Relatedness and Virtue can be described as oversensitive and unrestrained.
Rows 22 to 37 display the correlation between the Core Values Diagnostic, Schwartz’ Basic Values, and Holland’s model of vocational interests. Despite the six values scales holding significant correlations with all the scales, there is evidence of convergent validity. The scales that share a strong theoretical overlap with Schwartz and Holland’s scales hold stronger correlations than scales that do not share such overlap. For instance:
- Novelty and Power are strongly correlated to Stimulation, Power, Achievement, and Enterprising values.
- Mastery and Inquiry are strongly correlated to Achievement, Self-Direction, Universalism, and Investigative values.
- Relatedness and Virtue are strongly correlated to Benevolence, Tradition, and Social values.
Table 5: Convergent & Discriminant Validity Results
Concurrent validity
The following section describes the concurrent validity of the Core Values Diagnostic. We first describe the measures used to test for concurrent validity and then present correlations between the Core Values Diagnostic and these measures. We then conclude with an interpretation and discussion of these results.
Measures
The Counter Productive Work Behaviors Survey (Bennett & Robinson, 2000)
Counterproductive behavior (CWBs) describe employee behavior that goes against the interests of an organization and its incumbents. This can include behaviors such as absenteeism, abuse towards others, bullying, loafing, incivility, fraud, sexual harassment, and sabotage (Spector et al., 2006). To measure CWBs we used the 18-item CWB checklist that was developed by Bennet and Robinson (2000). The checklist contains 18 specific CWBs and participants rated the frequency of which they have displayed a given behavior (0 = never, 7 = daily). The scale was found to have acceptable levels of internal consistency and has been used extensively in research contexts.
The Utrecht Work Engagement Survey-9 items (UWES-9; Schaufeli & Bakker, 2006)
The UWES-9 is a 9-item scale measuring work engagement. It is a shorter version of the original 17-item UWES that characterizes work engagement by three subscales: Vigor, Dedication, and Absorption, which can be totaled to produce a single work engagement score — representing the extent to which an individual is cognitively, emotionally, and physically engaged with, and motivated by, their work. Participants respond to each item using a frequency 7-point Likert-scale (1 = Never to 7 = Always). Work engagement has been found to hold a positive relationship with a variety of organizational measures of performance (Saks, 2006).
Workaholism Scale — The Computerized Adaptive Assessment of Personality Disorders (CAT-PD; Simms et al., 2011)
The CAT-PD was developed to measure the alternative DSM-V model of personality disorders. The assessment contains 216 items, measuring 33 specific problematic dispositions that can be organized into the five overarching domains. Given the applied nature of the Core Values Diagnostic, data was not collected on all CAT-PD sub-scales due to their emotional sensitivity (i.e. depression, self-harm, etc.) or irrelevance (i.e. romantic disinterest). As such only data from the Workaholism scale was collected. Participants respond to each item using a five-point Likert scale (Very untrue of me / Untrue of me / Neutral / True of me / Very True of Me). The level of internal consistency for this scale was .83.
Concurrent Validity Results
Table 6 contains the correlations between the three measures of work-related behaviors (work engagement, workaholism, and counterproductive work behaviors), and the six scales.
First, work engagement was positively correlated with all scales. The strongest correlations were found between the Novelty, Inquiry, and Virtue scales. This suggests that individuals who value change, learning, and living according to their moral principles are more likely to be cognitively and emotionally engaged by their work. Second, workaholism was most positively correlated with Power scores, and negatively correlated with Inquiry scores. This suggests that individuals who are driven by power and status are most at risk of experiencing workaholism, while those individuals who value learning, arts, and culture are at a lowered risk. Finally, individuals who score high on the Power scale are most likely to display counterproductive work behaviors. Individuals who strongly value competition, status, and prestige are more likely to bend and break rules at work.
Table 6: Concurrent Validity Results
Summary of Validity Evidence
The analyses presented above effectively demonstrate that the six scales have good construct and concurrent validity. Not only do these analyses place the scales within a psychological taxonomy, the strong correlations provide evidence that the items are measuring the desired behaviors and overlap with adjacent psychological constructs.
Group Differences & Adverse Impact
This chapter reports on the extent to which different genders, age, and ethnic groups have statistically significant different scores on the Core Values Diagnostic. Understanding such differences may aid in the interpretation of feedback reports and scores. We then present the result for adverse impact simulations to demonstrate that the scales do not discriminate on the basis of age, gender, or ethnicity.
Group Differences
Independent samples t-tests were conducted to investigate whether males and females, Under and Over 45-year olds, and White and Non-White individuals scored significantly different across the six scales. Cohen’s d was also computed to understand to what extent are such differences practically meaningful.
Table 7-9 display the t-test results for gender, age, and ethnic differences. While there are statistically significant differences in scores across the various demographic groups, this is largely a product of the large samples used. Furthermore, Cohen’s d is small across every group difference. This means that despite there being statistically significant differences, such differences are not practically meaningful or impactful. Based on these results it can be concluded that scores on the Core Values Diagnostic do not meaningfully vary between demographic groups.
Table 7: Gender Differences
Table 8: Age Differences
Table 9: Ethnic Differences
Adverse Impact Simulations
Adverse Impact (AI) can be defined as “a substantially different rate of selection in hiring, promotion, or other employment decisions which works to the disadvantage of members of a race, sex or ethnic group” (see section 1607.16 of the Uniform Guidelines on Employee Selection Procedures, Equal Employment Opportunity Commission, Civil Service Commission, U.S. Department of Labor, 1978). The “Four-Fifths rule” can be used to determine whether an assessment has AI. Specifically, when the “selection rate for any race, sex or ethnic group which is less than four-fifths (4/5) (or eighty percent) of the rate for the group with the highest rate will generally be regarded by the Federal enforcement agencies as evidence of adverse impact.” (see section 1607.4 D; Equal Employment Opportunity Commission, 1978). Furthermore, given the Age Discrimination in Employment Act (Age Discrimination in Employment Act of 1967, 1967) states that individuals over 45 years old need protection, assessments should not adversely impact younger or older individuals.
While the previous analyses demonstrated statistically significant, although not practically meaningful, group differences, AI simulations of the 4/5ths rule were conducted to further demonstrate that the five scales do not adversely impact protected groups. To test for AI, we compared the selection rate of protected groups (females over 40-year old, and non-white individuals) against the selection rate of non-protected groups (males, under 40-year old, and white individuals). Ratios greater than or equal to .80 indicate that the assessment has no AI.
Although organizations do not need to conduct validity studies for selection tools that do not adversely impact protected groups, it is best practice that organizations do continually test for AI and continue to build evidence of criterion validity. As such, Deeper Signals recommends that organizations who use the Core Values Diagnostic pilot the tool and collect such evidence before using the diagnostic to inform their employee selection practices.
When using the assessment for talent decision-making it is recommended to use normed scores to ease interpretation and candidate comparison, and set the cutoff score for each Core Driver at the 15th percentile. Cutoff scores represent a balance between screening out individuals with the lowest or highest scores and not create adverse impact. While we supply these scores, we stress that low scores do not imply negative, unproductive, or harmful behaviors, and high scores do not imply positive and desirable behaviors. Individual difference constructs lie on a continuum whereby relative strengths and challenges can be found at either end (Widiger & Mullins-Sweatt, 2008). Accordingly, we recommend organizations conduct a job analysis to identify the most suitable value profile before using the tool to make personnel decisions. Adding to this, if organizations use different cutoff scores to those listed below, it is their responsibility to evaluate the potential for AI.
Using the cutoff scores listed below, we conducted AI simulations for three demographic dimensions: age, gender, and ethnicity. Table 10 displays the results of our AI analyses for gender, age, and ethnic groups when selecting out low scorers. As illustrated, the AI ratio was greater than .80 across each scale and demographic group. We can therefore conclude that when using the recommended cutoff scores organizations should not expect to see adverse impact or bias.
Table 10: Selection & Adverse Impact Ratios When Selecting Out Low Scores
References
Achor, S., Reece, A., Kellerman, G., & Robichaux, A. (2018). 9 Out of 10 People Are Willing to Earn Less Money to Do More-Meaningful Work. Retrieved October 5, 2019, from Harvard Business Review website: https://hbr.org/2018/11/9-out-of-10-people-are-willing-to-earn-less-money-to-do-more-meaningful-work?utm_source=facebook&utm_medium=social&utm_campaign=hbr
Age Discrimination in Employment Act of 1967. , Pub. L. No. Pub. L. No. 90-202, et seq (1967).
Akhtar, R., Humphreys, C., & Furnham, A. (2015). Exploring the relationships among personality, values, and business intelligence. Consulting Psychology Journal, 67(3), 258–276.
Akhtar, R., Ort, U., Winsborough, D., & Chamorro-Premuzic, T. (2019). Measuring and Assessing Individual Potential - Extremes Inventory - Technical Manual. Stockholm, Sweden.
Akhtar, R., Ort, U., Winsborough, D., & Premuzic, T. C. (2019). The Deeper Signals Core Drivers Diagnostic Technical Manual. New York, NY: Deeper Signals.
Bell, S. (2007). Deep-level composition variables as predictors of team performance: A meta-analysis. Journal of Applied Psychology, 92(3), 595–615. Retrieved from https://psycnet.apa.org/doiLanding?doi=10.1037%2F0021-9010.92.3.595
Bell, S. T., & Brown, S. G. (2015). Selecting and Composing Cohesive Teams. 17, 181–209.
Bennett, R. J., & Robinson, S. L. (2000). Development of a measure of workplace deviance. Journal of Applied Psychology, 85(3), 349–360.
Chatman, J. A. (1989). Improving Interactional Organizational Research: A Model of Person-Organization Fit. Academy of Management Review, 14(3), 333–349.
Cronbach, L. J. (1951). Coefficient alpha and the internal structure of tests. Psychometrika, 16(3), 297–334.
Deci, E. L., & Ryan, R. M. (2012). Self-Determination Theory. In P. A. M. Van Lange, A. W. Kruglanski, & E. T. Higgins (Eds.), Handbook of Theories of Social Psychology: Volume 1 (pp. 416–437).
Diefendorff, J. M., & Chandler, M. M. (2010). Motivating employees. In S. Zedeck (Ed.), APA handbook of industrial and organizational psychology, Vol 3: Maintaining, expanding, and contracting the organization. (pp. 65–135).
Donnellan, M. B., Oswald, F. L., Baird, B. M., & Lucas, R. E. (2006). The Mini-IPIP scales: Tiny-yet-effective measures of the Big Five factors of personality. Psychological Assessment, 18(2), 192–203.
Equal Employment Opportunity Commission, Civil Service Commission, U.S. Department of Labor, & U. S. D. of J. (1978). Uniform guidelines on employee selection procedures. Federal Register, 43, 38290–38309.
Furnham, A., Richards, S. C., & Paulhus, D. L. (2013). The Dark Triad of Personality: A 10 Year Review. Social and Personality Psychology Compass, 3(7), 199–216.
Gagné, M., & Deci, E. L. (2005). Self-determination theory and work motivation. Journal of Organizational Behavior, 26, 331-362.
Gallup. (2019). Employee Engagement on the Rise in the U.S. Retrieved October 5, 2019, from Gallup website: https://news.gallup.com/poll/241649/employee-engagement-rise.aspx?utm_source=link_wwwv9&utm_campaign=item_245786&utm_medium=copy
Goldberg, L. R., Johnson, J. A., Eber, H. W., Hogan, R., Ashton, M. C., Cloninger, C. R., & Gough, H. G. (2006). The international personality item pool and the future of public-domain personality measures. Journal of Research in Personality, 40(1), 84-96.
Hogan, R., & Hogan, J. (2007). Hogan Personality Inventory Manual (3rd ed.). Hogan Assessment Systems.
Hogan, S. J., & Coote, L. V. (2014). Organizational culture, innovation, and performance: A test of Schein’s model. Journal of Business Research, 67(8), 1609–1621.
Holland, J. L. (1959). A theory of vocational choice. Journal of Counseling Psychology, 6(1), 35-45.
Jonason, P. K., & Webster, G. D. (2010). The dirty dozen: A concise measure of the dark triad. Psychological Assessment, 22(2), 420–432.
Leary, T. G., Green, R., Denson, K., Schoenfeld, G., Henley, T., & Langford, H. (2013). The relationship among dysfunctional leadership dispositions, employee engagement, job satisfaction, and burnout. The Psychologist-Manager Journal, 16(2), 112–130.
Lindeman, M., & Verkasalo, M. (2005). Measuring Values With the Short Schwartz’s Value Survey. Journal of Personality Assessment, 85(2), 170–178.
Meade, A. W., Pappalardo, G., Braddy, P. W., & Fleenor, J. W. (2018). Rapid Response Measurement: Development of a Faking-Resistant Assessment Method for Personality. Organizational Research Methods, August.
Ogbonna, E., & Harris, L. C. (2000). Leadership style, organizational culture and performance: empirical evidence from UK companies. The International Journal of Human Resource Management, 11(4), 766–788.
Parks-Leduc, L., Feldman, G., & Bardi, A. (2015). Personality Traits and Personal Values: A Meta-Analysis. Personality and Social Psychology Review, 19(1), 3–29.
Pew Research Center. (2016). The State of American Jobs | Pew Research Center. Retrieved October 5, 2019, from Pew Research Center website: https://www.pewsocialtrends.org/2016/10/06/the-state-of-american-jobs/
Rich, B. L., Lepine, J. A., & Crawford, E. R. (2010). Job Engagement: Antecedents and Effects on Job Performance. Academy of Management Journal, 53(3), 617–635.
Rounds, J., Su, R., Lewis, P., & Rivkin, D. (2010). O*NET Interest Profiler Short Form Psychometric Characteristics: Summary. Retrieved from https://www.researchgate.net/publication/268327520_ONETR_Interest_Profiler_Short_Form_Psychometric_Characteristics_Summary
Ryan, R., & Deci, E. (2000). Intrinsic and Extrinsic Motivations: Classic Definitions and New Directions. Contemporary Educational Psychology, 25(1), 54–67.
Saks, A. M. (2006). Antecedents and consequences of employee engagement. Journal of Managerial Psychology, 21(7), 600–619.
Schaufeli, W. B., & Bakker, A. B. (2006). The Measurement of Work Engagement With a Short Questionnaire: A Cross-National Study. Educational and Psychological Measurement, 66(4), 701–716.
Schnell, T., Höge, T., & Pollet, E. (2013). Predicting meaning in work: Theory, data, implications. The Journal of Positive Psychology, 8(6), 543–554.
Schwartz, S. H. (1992). Universals in the content and structure of values: Theoretical advances and empirical tests in 20 countries. Advances in Experimental Social Psychology, 25, 1-65.
Schwartz, S. H. (1994). Are There Universal Aspects in the Structure and Contents of Human Values? Journal of Social Issues, 50(4), 19–45.
Schwartz, S. H. (2006). Basic Human Values: An Overview. Jerusalem Hebrew University, 49–71.
Schwartz, S. H. (2012). An Overview of the Schwartz Theory of Basic Values. Online Readings in Psychology and Culture, 2(1).
Simms, L. J., Goldberg, L. R., Roberts, J. E., Watson, D., Welte, J., & Rotterman, J. H. (2011). Computerized adaptive assessment of personality disorder: Introducing the CAT-PD project. Journal of Personality Assessment, 93, 380–389.
Spector, P. E., Fox, S., Penney, L. M., Bruursema, K., Goh, A., & Kessler, S. (2006). The dimensionality of counterproductivity: Are all counterproductive behaviors created equal? Journal of Vocational Behavior, 68(3), 446–460.
Van den Broeck, A., Ferris, D. L., Chang, C.-H., & Rosen, C. C. (2016). A Review of Self-Determination Theory’s Basic Psychological Needs at Work. Journal of Management, 42(5), 1195–1229.
Verplanken, B., & Holland, R. W. (2002). Motivated decision making: effects of activation and self-centrality of values on choices and behavior. Journal of Personality and Social Psychology, 82(3), 434–447.
Widiger, T., & Mullins-Sweatt, S. (2008). Five-Factor Model of Personality Disorder: A Proposal for DSM-V. Annual Review of Clinical Psychology, 5(1), 197–220.


