How to build a Personality Analytics engine


For a few months now we’ve been working hard to add Personality Analytics to the Deeper Signals platform. Designing and building an analytics engine is a significant undertaking. It required re-thinking our data architecture, cleaning up old code, and a lot of work and rework on the user-interface. As we close in on the finish line, I thought I’d share a bit about the process and what the final product will (hopefully) look like.
The most important question was why. The scope of this project and the investment it would require made us second-guess ourselves throughout the planning process. Would it really provide value to our clients? What’s the ROI? Ultimately the answer was simple. Deeper Signals assessments are unique in that we enable organizations to offer self- and other- awareness to the entire organization. If leaders have access to accurate psychological data across their entire workforce, their ability to predict and understand performance is unparalleled.
We already knew our clients are using Core Drivers data this way by exporting it to existing Insights & Analytics solutions. Adding that capability to our own platform would be a clear differentiator. It also allows us to structure the data and visualizations in a way that makes it easy to add a new layer of insight into the critical questions organizations are always asking, such as, “what’s driving attrition?”, “why are these teams more engaged than other teams?”, and “why are some leaders more successful than others?”
Next we considered our current data structure. Integrating HRIS data required adding many more fields to our existing indexes. This led to an analysis of the data we currently store in Elastic, the structure of that data, and we even considered migrating all of our data to a data warehouse such as Snowflake or Redshift. Our data team spent countless hours researching the pros and cons and speaking to experts on Big Data, AI and Elastic Search. We needed to balance time, cost and future roadmap requirements. It was a hard call, but ultimately, we opted to stick with Elastic (for now) and to restructure how the data is stored and to move out some older data that never really belonged in Elastic in the first place.
Planning the UI brought us to the age-old buy or build question. There are a number of embeddable and SDK graphing and charting packages we could have used to speed up the project. Google’s Looker is the premium product in this space, but RevealBI or High Charts are affordable and would also be sufficient. Buying would save us heaps of time and guarantee a feature rich product. Some options even offer machine-learning models out of the box, which is a feature on our roadmap. However, the downside of buying were also obvious. For one, the cost of these packages range from $10k – $100k, annually. More importantly, once users start creating their own visualizations it would be a nightmare to migrate to our own engine down the line. Ultimately, we decided to build. But anyone who has faced the buy or build question knows it never really goes away. It’s always there to remind you that you could have gone the other way, especially late at night when you can’t seem to remember why you started the project in the first place.
Global charts, Assessment charts, or Project charts? As we build out the UI these are the questions we are still answering. On the one hand it would be fabulous to create graphs across different assessments or projects in one dashboard. On the other hand, we know users share access to dashboards and want to restrict data to specific assessments or projects. We also didn’t want to lose the existing default charts that load with every Core Drivers assessment. Which means we need to have default charts and editable charts. Do these go on the same dashboards or different dashboards? When we launch, we’ll have drag-and-drop chart builders for Assessments and Projects. Later on, we’ll add a global charting dashboard for specific clients. We’re still figuring out the default charts functionality.
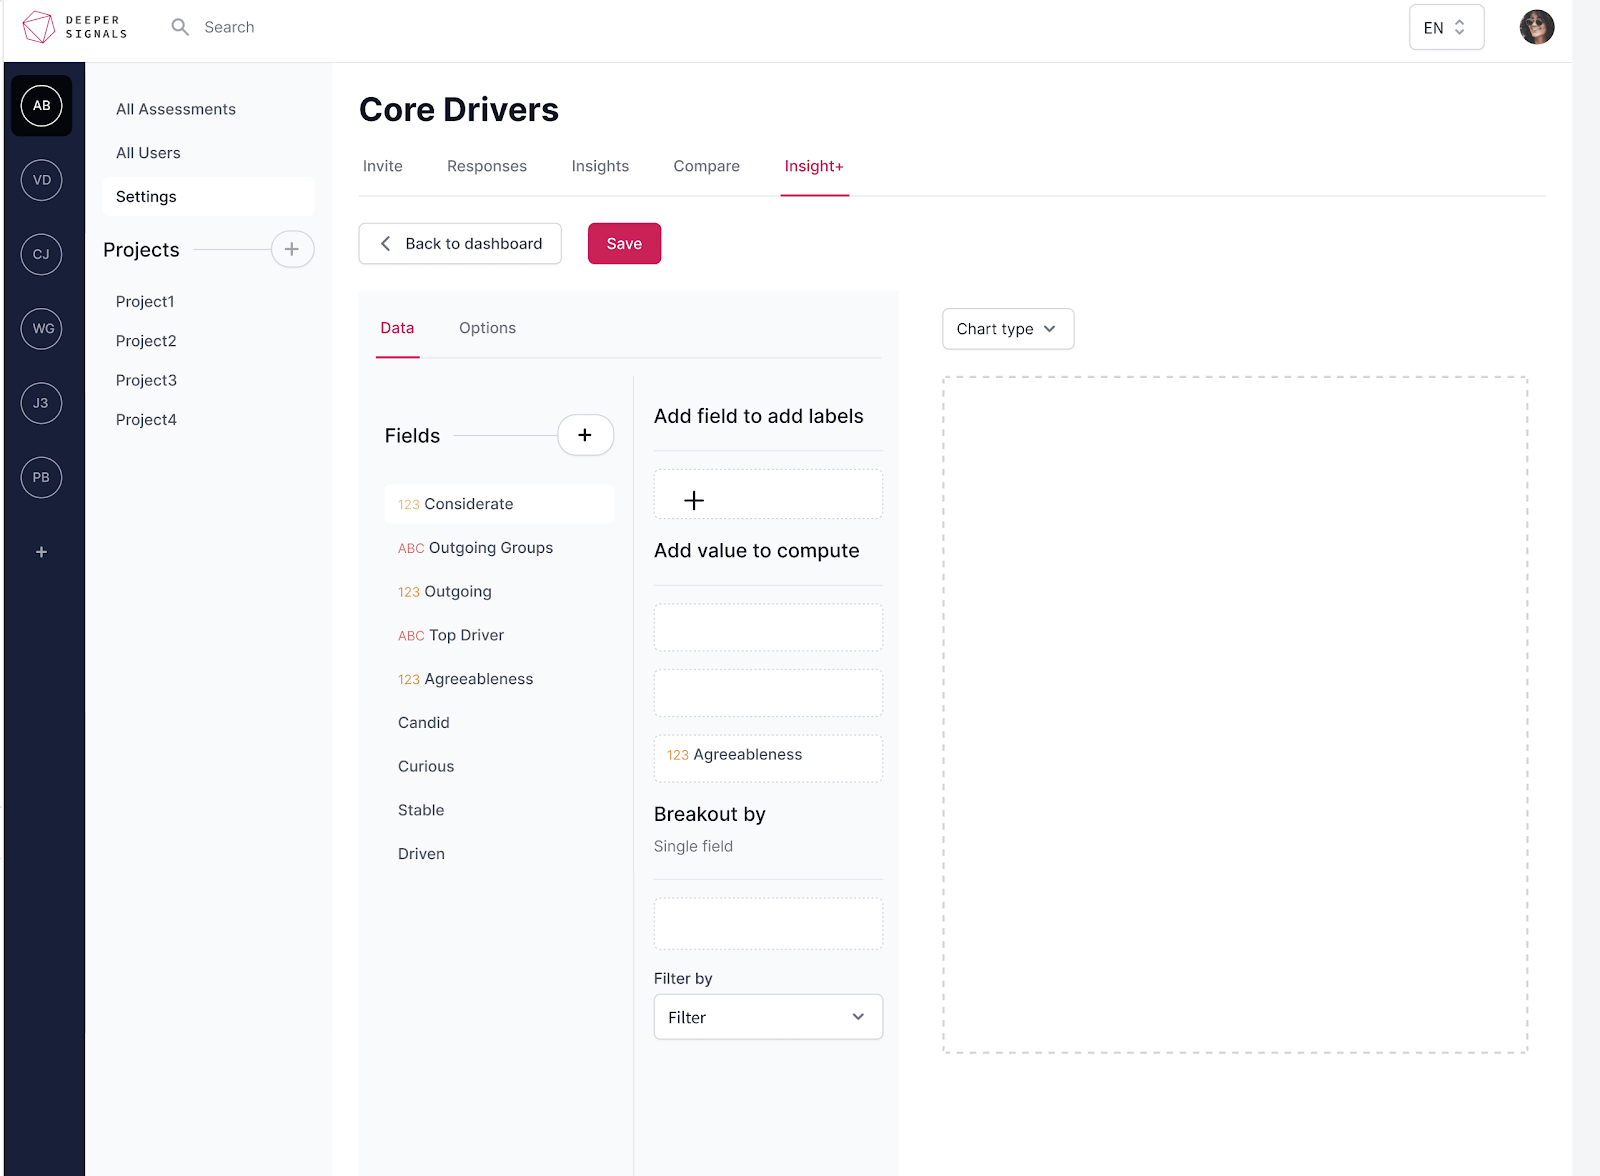
So when is it coming out? It’ll take another two weeks to write all of the backend code and finish the Elastic restructuring. At that point our frontend team should be done with the general design refresh (a story for another time) and we can focus 100% of our energy on the Personality Analytics frontend. That should take another 2-3 weeks. So hopefully by the second week of September we should be ready for prime time. Here’s a sneak peek of where we’re up to with the design.
I know we’ve been quiet on the feature front for some time, but we're confident it will be well worth the wait. Looking back at writing this blog, it sure seems a lot simpler than it felt going through it, but trust me, it was a lot of work. Hopefully this gives you some insight into what we’ve been up to. If you have questions or suggestions, don’t hesitate to reach out to me.